Precision farming opens an opportunity to increase the gain for a farmer up to 20% with fewer trees.
Making a sustainable profit from farming can be something like tossing a coin. However, today the advancements in digital technology provide the incredible benefit of reducing the unpredictability of farming in general. In pecan farming in particular, the proper know-how of a combination of multiple factors such as soil composition, environmental impact, climate, irrigation and sunlight management are vital for success. Hard data is essential for innovating key decisions. Riaan Burger, a South African farmer, successfully uses open source GIS software to tackle the issues of collecting and utilising such vital data.
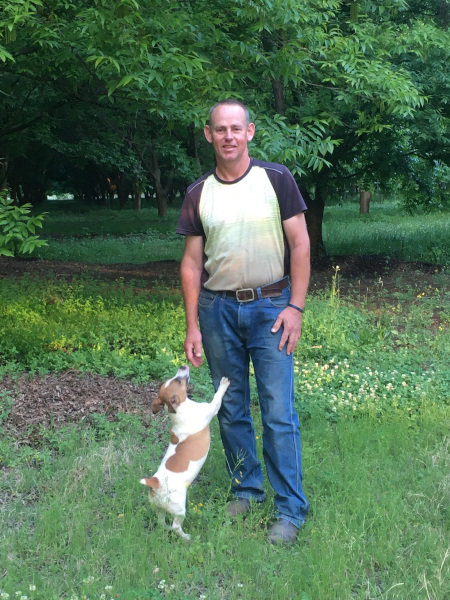
Riaan Burger on his pecan farm.
Becoming a Farmer
Riaan Burger’s journey started back in 2017 when, after 20 years’ working as an electrical engineer, he decided to embark on his own business in pecan nut farming. He is a self-taught farmer and co-owner of one of the biggest pecan farms in the district of Weenen, South Africa. At first, Riaan had only a rough idea of how to improve his newly bought 24 hectares of planted orchard.
After reading books on soil structure, type, depth and chemical analyses, he had soil samples taken to create a soil sample map. In his orchard, the trees were planted in 10x10 metres geometric layouts. After 20 years, the trees were already creating shade. Riaan knew that sunlight penetration is important and that pecan trees are susceptible to fungus, so he decided to take a closer look.
“The previous owner of the farm had already started chopping out every second tree. I was in the position where I could compare the yield from areas where trees had been chopped down, to areas where they had not been felled,” explains Riaan.
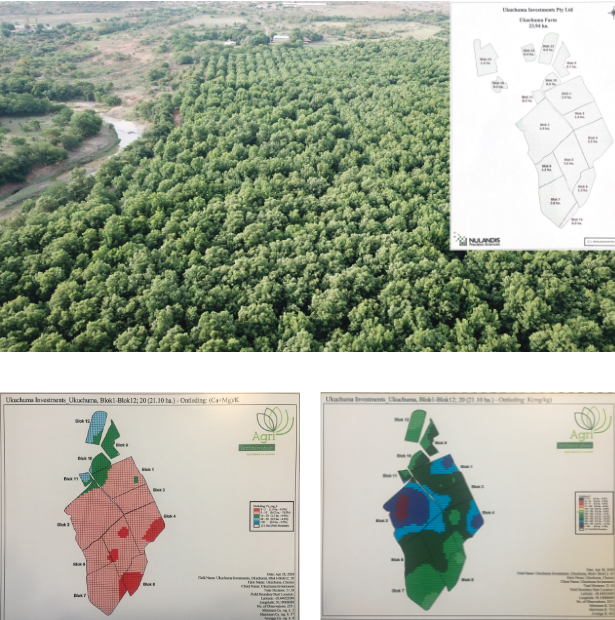
A photo of the farm taken by drone and initial stage of farming - soil maps.
Riaan realised that understanding the ambient conditions and mapping them to yield results was the right way to go. This was the beginning of his exciting journey in precision farming.
Collecting Data from the Field
It was no easy task for Riaan to get a complete picture. For two years, he only recorded the yield per day, and the relevant orchard block. Later, he used the services of a local consulting company which provided him with surveying applications to help him to set up a basic workflow.
“I record the weight of pecan nuts from each individual tree and I plot it on the map,” Riaan says. “And then afterwards I can see the different cultivars of trees, the weight of nuts they produced and the area in which they were produced. I previously had soil samples taken, so I’ve got soil sample maps. Now I can overlay a yield map over the soil sample map and correlate them”
Despite working well with the surveying app, Riaan was still in need of assistance to prepare data tables and then to export them to Excel sheets and to request map creation. After the consulting company moved from a third-party app to the in-house build solution, things got worse for Riaan: “It was a generic tool and a difficult app to work with. Displaying data was cumbersome. I wanted something that was quick and easy again. Ideally, I would like to capture data on the iPad and have it directly linked to my laptop – that is how I think it should work.”
So Riaan discovered the Input and Mergin suite, a surveying app based on QGIS and a cloud service for data synchronisation, respectively. Despite only a basic knowledge of QGIS and the necessity to learn and experiment, the effort immediately paid off!
“I’ve got Input, I’ve got a Mergin account and I’ve got QGIS. I now have full control of the process. I don’t need to fund a consultant and find that by 8 o’clock at night he has not yet responded to my query, and so I have to back it up with a WhatsApp call,” Riaan explains. “This is something I created entirely myself. I don’t need to ask someone to change this map, or add that icon, modify the legend or change the styling, I am in control of all of it! And I think there is a sense of satisfaction when one gets things going for oneself.”
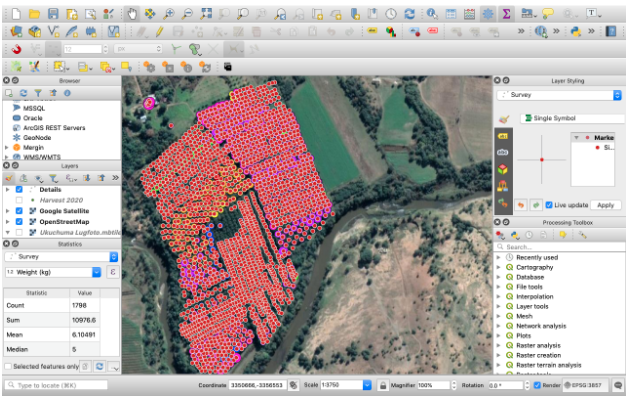
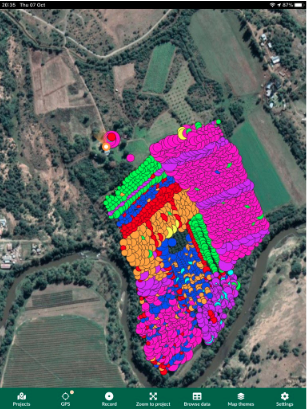
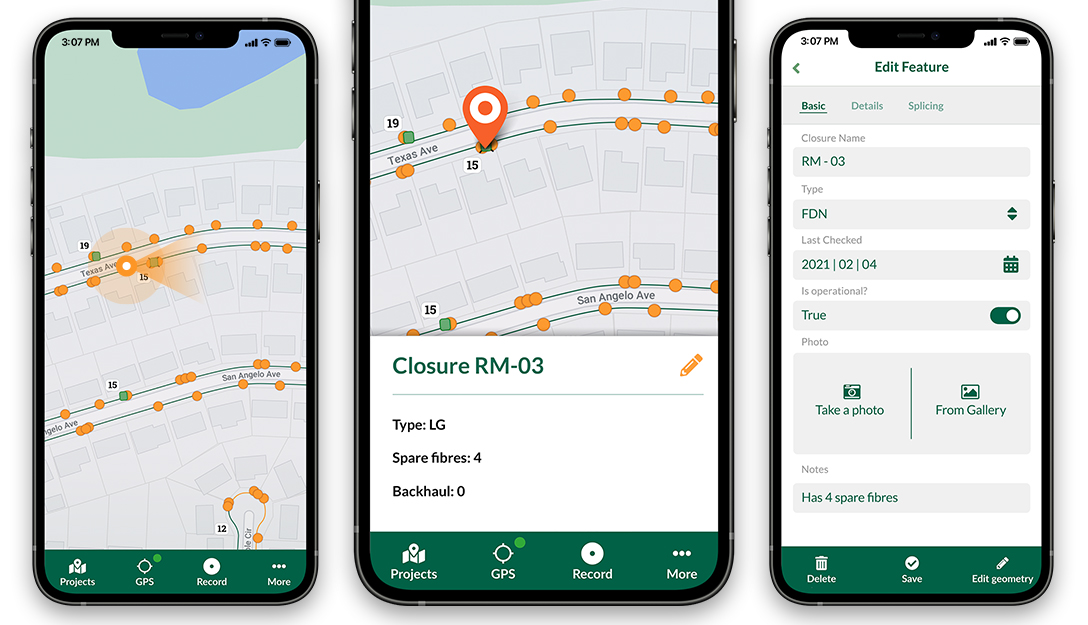
A farming project in QGIS desktop and Input app UI.
With the Input app, Riaan has gained control of the workflow – something not before experienced. He has gained the freedom to set the project according to his own individual needs. Without much effort, not only the data but the styling, an important factor for him, are synchronised.
“In QGIS I created a style where each bubble represents the kilograms of the yield and the colour represents the variety,” says Riaan. “Then I saw in Input that there is suddenly an extra page on my iPad. So now I have the bubbles and bubble colours on the iPad instantly, which I did not have in previous apps. Previously, I had to create it the long way around, but now it is suddenly on the iPad automatically. I enjoy having that available! In the past, I only had that information by the end of the harvest.”
Cutting Down Trees
The energy invested in creating workflow, capturing and analysing data paid off handsomely for Riaan. All his initial doubts were suddenly eliminated. He has all the information essential for making any important decision right at his fingertips.
“The first time you fell trees, you have nightmares! How on earth you can be cutting your income and destroying 20 years of growth? Now, with the necessary proof at hand, it is easier in your mind to motivate that tree felling is actually your source of income, that it is the right thing to do,” says Riaan. “You can see that the yield from the remaining trees is more than double than before. The trees are healthier, because of allowing sunlight in. Moreover, you also get less pressure from fungus, because pecan trees are easily susceptible to fungus. Now that you have good ventilation, because you have a draught through your orchard, you can see on the map what your exposure to fungus is.”
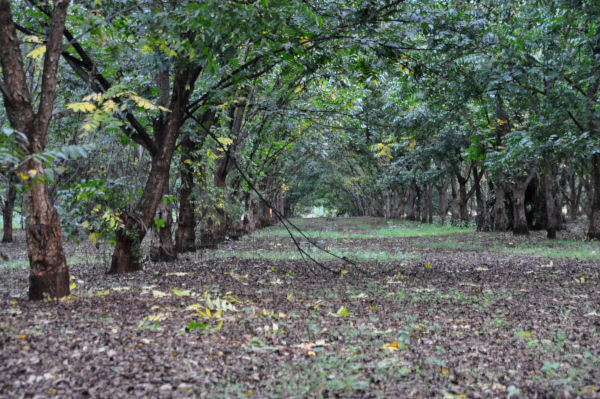
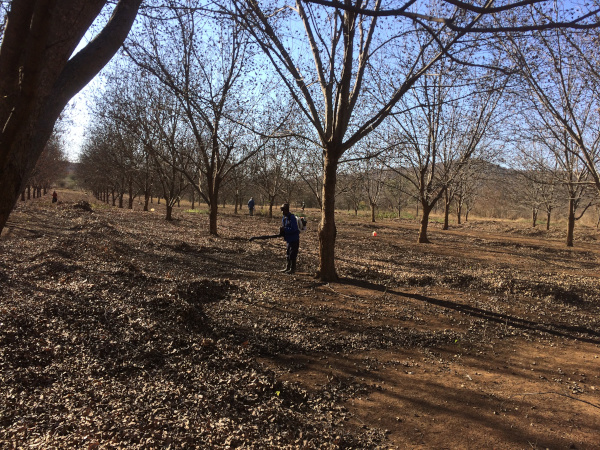
Orchard with higher density of trees (top) and lower density (bottom).
Riaan continues: “I am not a sole owner, I have a partner. Now I have the data available, so that when we have a meeting I can explain to him this is what I did, this is what happened and this is the result. If you go to a bank manager for a loan, I mean, he really frowns at you when you tell him you are cutting down your trees which produce your income. Then you can explain to him why it is for the better.”
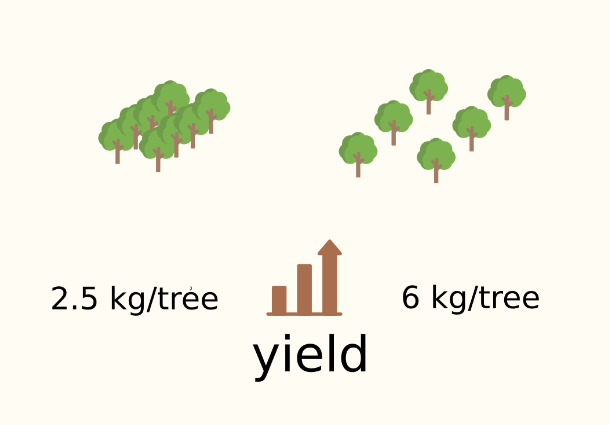
Increase in yield per tree after reduction of tree density.
Harvest Data Analysis and Beyond
The benefits of collecting and interpreting data carefully are limitless. Cutting down trees is just one example of the many advantages of careful data gathering and interpretation.
“Now I see that certain cultivars perform better than others this year,” adds Riaan. “So I can see if they consistently perform better or worse. I can decide, based on these results, what to do: if I need to add more nitrogen or improve soil pH, or whatever the case may be.”
User-friendly tools tailor-made to specific needs, such as the Input and Mergin suite, provided Riaan a way of collecting and analysing his specific type of farming data. His insights for necessary improvements also developed over the past few years.
“At first I did not have the distinction between individual trees and I even said to my partner” continues Riaan, “if only I’d started doing this in the very first season, I would have had 5 years of data to compare – but I didn’t. I will definitely continue to use this suite. It is valuable and I have been using it only for harvest. However, I see now that I can start recording where I have cut down a tree, so I have a record of when and where the tree was cut. I can also record my irrigation data.”
In spite of initial teething problems and the difficult decisions he had to take, Riaan’s success is proof that he has found the right way to go for his own specific pecan farming needs. He has even become an evangelist within the local farming community.
“I am not the only pecan farmer in our district. I am the biggest pecan farmer, but not the only one. I am trying to spread the word around. For example, my neighbour still does not want to cut down his trees. But I am getting there, showing him photos, proving that you have to be aggressive to open up the orchard to get sunlight in – and here is the proof that it has been working for me!”
Download Mergin Maps Today
![]()
