As a part of our crowdfunding campaign we have introduced a new method to handle a large number of point cloud files. In this article, we delve into the technical details of the new format, rationale behind our choice and how you can create, view and process virtual point cloud files.
Lidar surveys of larger areas are often multi-terabyte datasets with many billions of points. Having such large datasets represented as a single point cloud file is not practical due to the difficulties of storage, transfer, display and analysis. Point cloud data are therefore typically stored and distributed split into square tiles (e.g. 1km x 1km), each tile having a more manageable file size (e.g. ~200 MB when compressed).
Tiling of data solves the problems with size of data, but it introduces issues when processing or viewing an area of interest that does not fit entirely into a single tile. Users need to develop workflows that take into account multiple tiles and special care needs to be taken to deal with data near edges of tiles to avoid unwanted artefacts in outputs. Similarly, when viewing point cloud data, it becomes cumbersome to load many individual files and apply the same symbology.
Here is an example of several point cloud tiles loaded in QGIS. Each tile is styled based on min/max Z values of the tile, creating visible artefacts on tile edges. The styling has to be adjusted for each layer separately:

In the GIS world, many users are familiar with the concept of virtual rasters. A virtual raster is a file that simply references other raster files with actual data. In this way, GIS software then treats the whole dataset comprising many files as a single raster layer, making the display and analysis of all the rasters listed in the virtual file much easier.
Borrowing the concept of virtual rasters from GDAL, we have introduced a new file format that references other point cloud files - and we started to call it virtual point cloud (VPC). Software supporting virtual point clouds handles the whole tiled dataset as a single data source.
At the core, a virtual point cloud file is a simple JSON file with .vpc extension, containing references to actual data files (e.g. LAS/LAZ or COPC files) and additional metadata extracted from the files. Even though it is possible to write VPC files by hand, it is strongly recommended to create them using an automated tool as described later in this post.
On a more technical level, a virtual point cloud file is based on the increasingly popular STAC specification (the whole file is a STAC API ItemCollection). For more details, please refer to the VPC specification that also contains best practices and optional extensions (such as overviews).
We have added support for virtual point clouds in QGIS 3.32 (released in June 2023) thanks to the many organisations and individuals who contributed to our last year’s joint crowdfunding with North Road and Hobu. The support in QGIS consists of three parts:
Those who prefer using command line tools, PDAL wrench includes a build_vpc command to create virtual point clouds, and all the other PDAL wrench commands support virtual point clouds as the input.
In this tutorial, we are going to generate a VPC using the new Processing algorithm, load it in QGIS and then generate a DTM from terrain class. You will need QGIS 3.32 or later for this. For the purpose of this example, we are using the LiDAR data provided by the IGN France data hub.
In QGIS, open the Processing toolbox panel, search for the Build virtual point cloud (VPC) algorithm ((located in the Point cloud data management group):

In the algorithm’s window, you can add point cloud layers already loaded in QGIS or alternatively point it to a folder containing your LAZ/LAS files. It is recommended to also check the optional parameters:

After you set the output file and start the process, you should end up with a single VPC file referencing all your data. If you leave the optional parameters unchecked, the VPC file will be built very quickly as the algorithm will only read metadata of input files. With any of the optional parameters set, the algorithm will read all points which can take some time.
Now you can load the VPC file in QGIS as any other layer - using QGIS browser, Data sources dialog in QGIS or by doing drag&drop from a file browser. After loading a VPC in QGIS, the 2D canvas will show boundaries of individual files - and as you zoom in, the actual point cloud data will be shown. Here, a VPC loaded together with the overview point cloud:

Zooming in QGIS in 2D map with elevation shading - initially showing just the overview point, later replaced by the actual dense point cloud:

In addition to 2D maps, you can view the VPC in a 3D map windows too:
If the input files for VPCs are not COPC files, QGIS will currently only show their boundaries in 2D and 3D views, but processing algorithms will work fine. It is however possible to use the Create COPC algorithm to batch convert LAS/LAZ files to COPC files, and then load VPC with COPC files.
It is also worth noting that VPCs also work with input data that is not tiled - for example, in some cases the data are distributed as flightlines (with lots of overlaps between files). While this is handled fine by QGIS, for the best performance it is generally recommended to first tile such datasets (using the Tile algorithm) before doing further display and analysis.
Now that we have the VPC generated, we can run other processing algorithms. For this example, we are going to convert the ground class of the point cloud to a digital terrain model (DTM) raster. In the QGIS Processing toolbox, search for Export to raster algorithm (in the Point cloud conversion group):

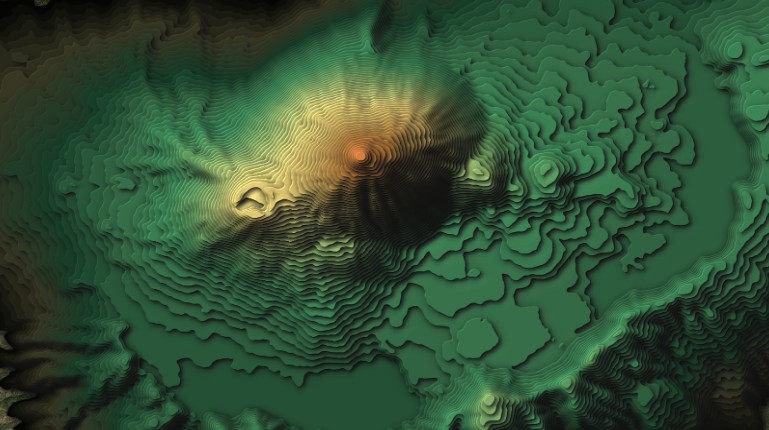
This will use the Z values from the VPC layer and generate a terrain raster based on a user defined resolution. The algorithm will process the tiles in parallel, taking care of edge artefacts (at the edges, it will read data also from the neighbouring tiles). The output of this algorithm will look like this:

The output raster contains holes where there were no points classified as ground. If needed for your use case, you can fill the holes using Fill nodata algorithm from GDAL in the Processing toolbox and create a smooth terrain model for your input Virtual Point Cloud layer:

Virtual point clouds can be used also for any other algorithms in the point cloud processing toolbox. For more information about the newly introduced algorithms, please see our previous blog post.
All of the point cloud algorithms also allow setting filtering extent, so even with a very large VPC, it is possible to run algorithms directly on a small region of interest without having to create temporary point cloud files. Our recommendation is to have input data ready in COPC format, as this format provides more efficient access to data when spatial filtering is used.
One of the very useful features of VPCs is that they work not only with local files, but they can also reference data hosted on remote HTTP servers. Paired with COPCs, point cloud data can be streamed to QGIS for viewing and/or processing - that means QGIS will only download small portions of data of a virtual point cloud, rather than having to download all data before they could be viewed or analysed.
Using IGN’s lidar data provided as COPC files, we have built a small virtual point cloud referencing 16 km2 of data (nearly 700 million points). This VPC file can be loaded in QGIS and used for 2D/3D visualisation, elevation profiles and processing, with QGIS handling data requests to the server as necessary. Processing algorithms only take a couple of seconds if the selected area of interest is small (make sure to set the “Cropping extent” parameter of algorithms).
All this greatly simplifies data access to point clouds:
We are very excited about the opportunities that virtual point clouds are bringing to users, especially when combined with COPC format and access from remote servers!
Thanks again to all contributors to our crowdfunding campaign - without their generous support, this work would not have been possible.
Contact us if you would like to add more features in QGIS to handle, analyse or visualise lidar data.
Let's make the QGIS work for you
Lutra Consulting is a QGIS-focused expert provider of geospatial software development, consulting, training, and support services.