
Although 3D maps have significantly improved GIS data visualisation, contour maps are still valuable tools that can sometimes represent the shape of terrain more effectively. In this blog post, we will look at different ways to create and visualise contour data.
If you already have the digital terrain model in the form of a raster, you can skip this section.
There are multiple sources for terrain data, depending on the location. Some countries provide high-resolution terrain data created from LiDAR or point cloud data. Additionally, global digital terrain models are available. These can be downloaded using the OpenTopography plugin in QGIS.
Below is an example of the Tenerife island terrain model from Europe DTM 30m.

Styling your raster as contour lines within the Styling panel is the simplest approach to view contours without the need for data conversion.

The output will look something like the image below:

The approach above has limitations in terms of line simplification and does not allow for the labeling of contour lines.
To convert your terrain raster to a contour vector layer, you can run the contour tool in the Processing toolbox (under GDAL > Raster extraction > Contour). You must select the desired intervals for the contours when using this tool.
The Smooth algorithm, located in Vector geometry within the Processing toolbox, can be used to simplify and smooth jagged contour lines. These jagged lines may result from the use of a very high resolution terrain model.
The contours created in the previous step can be styled using rule-based styling to visually distinguish the main (or index) contours from the minor contours.

The above styling will result in:

You can also label the main contours. Using the default labelling can result in labels placed on random parts of the map. You can follow this excellent video tutorial to place the labels along a line (e.g. a ridge or a valley).
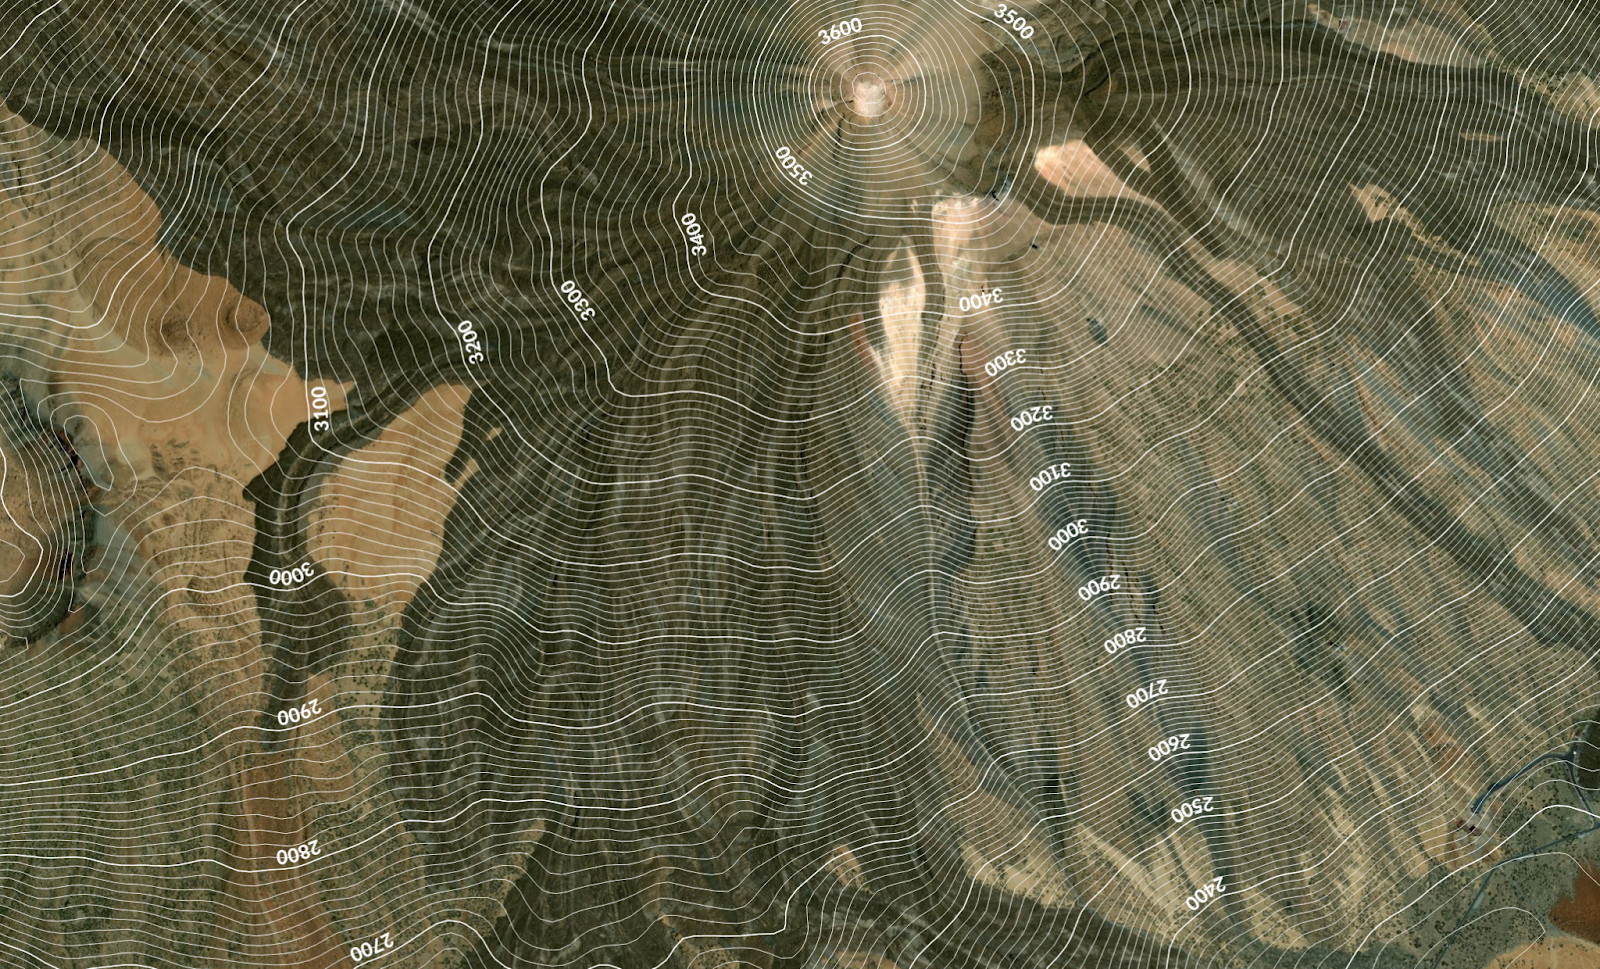
Contours created in the previous step can be turned into polygon using Lines to polygon algorithm in the Processing toolbox. With Draw effects and rendering order in the QGIS styling you can create maps like this:


Feel free to reach out to us if you have any questions about 3D tools or if you find that QGIS is missing any features.
Let's make the QGIS work for you
Lutra Consulting is a QGIS-focused expert provider of geospatial software development, consulting, training, and support services.


.png)

